Twenty years of ranking factor studies, side by side
Every Moz and Searchmetrics correlation we could recover, the vendor studies that replaced them, and two decades of expert votes, set against what Google's own leaked documentation showed in 2024. Each number carries a grade for how we read it.
Links and authority are the one factor where belief, measurement and later evidence agree.
Experts ranked them first in every Moz survey, they topped every correlation study from Moz 2011
(Page Authority 0.28) to SEMrush 2024 (Authority Score 0.21), and the 2024 leak contains a
siteAuthority feature. Keyword in the title is the mirror case: the experts' top
on-page factor for ten years, correlated at 0.02 to 0.04, and scored by Google anyway. Social
shares correlated about as well as links and were never a direct factor. Clicks are the largest
reversal: publicly dismissed, then described in trial testimony and named in the leak.
What experts believed against what correlated, in one year
Moz's 2015 edition is the cleanest test in the record. It asked its panel to score each factor and measured the same factors against rankings, then printed both. Plotting one against the other splits the factors into two failure modes that recur through every later study.
Top left are the social counts: Facebook, Google +1 and tweets, rated lowest of anything on
the survey and correlated nearly as well as links. Matt Cutts said in 2013 that Google was not
using +1s that way and that good content earns both shares and links (Hacker News).
Bottom right are keyword in title and mobile, rated near the top and correlated at about zero.
They are saturated: when nearly every ranking page has the keyword in its title, there is no
variance left for a rank correlation to find. The leak's titlematchScore says titles
are scored regardless (iPullRank).
Every correlation we could recover, 2011 to 2016
This is the only stretch in which two independent vendors measured overlapping factors with the same statistic. Moz values are the most reliable in the record: printed on the page, or printed as labels on its 2011 chart images. Searchmetrics values come from a press write-up (2012) and from chart labels matched by order in its 2015 whitepaper transcript. Its 2013, 2014 and 2016 coefficients survive only as search snippets or unread chart images, so they are left out.
Show the table: 23 factors across five studies
The small letter after a value says how we read it: T printed in the study, T2 quoted by someone else, C read off a chart. A dot means not recovered. All grades.
| Factor | Moz 2011looked at the top 30 results | Searchmetrics 2012results checked: not stated | Moz 2013looked at the top 50 results | Searchmetrics 2015looked at the top 30 results | Moz 2015looked at the top 50 results |
|---|---|---|---|---|---|
| Links and authority | |||||
| Linking root domains | 0.24I | · | 0.29T | 0.22O | 0.30T1 |
| Backlinks (count) | · | 0.36T2 | · | 0.28O | · |
| IPs / C-blocks linking | 0.25I | · | 0.29T | · | 0.31T |
| Moz Page Authority | 0.28I | · | 0.39T | · | 0.37T |
| Moz Domain Authority | 0.21I | · | 0.27T | · | 0.26T |
| Exact-anchor linking domains | 0.24I | · | 0.28T | 0.17O2 | 0.28T |
| Partial-anchor linking domains | 0.25I | · | 0.29T | · | 0.29T |
| Social and brand | |||||
| 0.28I | 0.37T23 | 0.27T | 0.28O4 | 0.27T5 | |
| Google +1 | · | · | 0.30T | 0.31O | 0.27T |
| Tweets | 0.17I | 0.25T2 | 0.21T | 0.23O | 0.21T |
| Brand mentions | · | · | 0.20T | · | 0.19T |
| Domain | |||||
| Exact-match domain | 0.22I6 | 0.11T2 | 0.20T | −0.02O | 0.20T |
| Partial-match domain | 0.16I | · | 0.06T | · | 0.07T |
| On-page | |||||
| Keyword in title | 0.04I7 | · | · | · | 0.02T |
| Keyword in body | 0.07I | · | 0.12T | 0.07O | 0.11T |
| Topic or language model | ·8 | · | 0.13T | 0.15O9 | 0.13T |
| Content length | 0.09I10 | · | 0.09T | 0.07O11 | 0.12T |
| Technical | |||||
| Server response time | −0.05I | · | −0.10T | · | −0.10T |
| HTTPS | · | · | · | 0.05O | 0.04T |
| Schema.org markup | · | · | 0.02T | · | 0.01T |
| Authorship markup | · | · | −0.03T | · | · |
| Mobile | · | · | · | 0.00O12 | −0.04T13 |
| Outcomes posing as inputs | |||||
| Click-through rate | · | · | · | 0.67O14 | · |
Two patterns hold through every caveat. Link and social counts sit between 0.17 and 0.39 in both vendors' data, while on-page keyword measures sit between −0.02 and 0.15. And Moz's 2013 and 2015 numbers barely moved, which suggests the rise from 2011 owed at least as much to the switch from the top 30 to the top 50 results as to anything Google changed. On the 2015 sample, Ahrefs' referring-domain count correlated 0.34 against 0.30 for Moz's own count: the link index alone moves the coefficient (Moz 2015).
After 2016, every vendor brought its own ruler
Searchmetrics dropped its universal study in December 2016 for industry studies that report ratios instead of rho (press release; why it ended). The tool vendors that followed used different depths, statistics and outcomes, and several of their strongest factors are their own product metric.
Show the table: six studies, 2016 to 2025
The small letter after a value says how we read it: T printed in the study, T2 quoted by someone else, C read off a chart. A dot means not recovered. All grades.
| Factor | Backlinko 20161M results, directional | SEMrush 2017random forest order, top 100 | Backlinko 202011.8M results, no coefficients | SEMrush 2024Spearman on per-position averages, top 20 | Surfer 2025Spearman | Ahrefs 2025AI Overview visibility, not rank |
|---|---|---|---|---|---|---|
| Referring domains / backlinks | #1 factorT2 | 5th, after four traffic factorsP | #1 result has 3.8x the backlinksT | RDs 0.18P | · | RDs 0.295; backlinks 0.218T |
| Vendor authority metric | · | · | · | Authority Score 0.21P | · | DR 0.326T |
| Keyword in title | · | 15thP | on 65 to 85% of results, about zero correlationT | no correlation; 21.7% use the exact keywordP | · | · |
| Content length | first page averages 1,890 wordsT2 | · | 1,447 words, no correlationT | 0.02P | · | · |
| Relevance / content score | · | · | · | text relevance ~0.47C | Surfer Content Score 0.28T | · |
| Speed / Core Web Vitals | · | · | zeroT | LCP ~0.09C | · | · |
| HTTPS | · | · | · | 0.007 at 98% adoptionP | · | · |
| Engagement / traffic | · | 1st to 4th: direct visits, time on site, pages per session, bounceP | time on site strongT | URL traffic 0.33 P; direct share 0.09P | · | · |
| Exact-match domain | · | · | · | · | EMDs performed betterT | · |
| AI-written content | · | · | · | · | no correlationT | · |
| Brand | · | · | · | · | · | branded mentions 0.664; branded anchors 0.527; branded search 0.392T |
Backlinko published no coefficients in either study, so its findings are directional. SEMrush 2017 reported that every correlation was below 0.3, which is why it switched to a random forest ranking. Its top four factors were traffic estimates, which raises the question of whether sites rank because they get traffic or the reverse. Two descriptive series need no coefficient at all: the average #1 page was 2 years old in 2017 and 5 years old in 2025 (Ahrefs), and domains passing Core Web Vitals at the Page Experience rollout gained 3.7% visibility against 2.7% for the average domain (SISTRIX).
What the experts voted for, 2005 to 2015
Moz asked its expert panel to score ranking factors in six editions. The scoring scale changed almost every time, so the raw numbers cannot be lined up. Ranks can: below, each factor is placed by where the panel put it that year.
Exact-match domains are the sharpest swing. Experts put them joint 8th of 9 in 2005, then made them the single highest-rated factor of 2011 (97.0 of 100), in the same edition whose own data showed the .com EMD correlation falling from 0.38 in June 2010 to 0.22 (Moz 2011). Anchor text went the other way: 1st in 2009, 12th of 18 by 2015, while its correlation sat at 0.24 to 0.28 throughout. Practitioners updated on penalties, not on the studies.
| Factor | 20059 rated here | 200711 rated here | 20099 rated here | 201113 rated here | 201317 rated here | 201518 rated here |
|---|---|---|---|---|---|---|
| Keyword in title tag | 1st | 1st | 3rd | 2nd | 1st | 1st |
| Content quality | 5th | =6th | 4th | 3rd | 2nd | 2nd |
| Keyword in body | 3rd | 4th | · | 8th | 3rd | 3rd |
| Mobile-friendly | · | · | · | · | 12th | 4th |
| Link popularity | 4th | =2nd | 2nd | 7th | 4th | 5th |
| CTR / user metrics | 6th | =8th | 6th | · | 7th | 6th |
| Topic modelling | · | 5th | · | 10th | 6th | 7th |
| Speed | · | · | · | 11th | 10th | 8th |
| Brand search | · | 10th | 7th | · | 5th | 9th |
| Keyword in URL | 7th | =8th | · | 6th | 13th | 10th |
| Keyword / exact-match domain | =8th | =6th | 5th | 1st | 9th | 11th |
| Exact anchor text | 2nd | =2nd | 1st | 5th | 8th | 12th |
| Schema / structured data | · | · | · | 12th | 15th | 13th |
| HTTPS | · | · | · | · | · | 14th |
| Authorship | · | · | · | · | 11th | 15th |
| Google +1s | · | · | · | · | 14th | 16th |
| Tweets | · | · | 8th | 4th | 16th | 17th |
| Facebook shares | · | · | 9th | 9th | 17th | 18th |
| Meta keywords | =8th | 11th | · | 13th | · | · |
Show the raw scores, each on its own scale
| Factor | 20051 to 5 scale | 20071 to 5 scale | 2009% importance scale | 20110 to 100 scale | 20131 to 10 scale | 20151 to 10 scale |
|---|---|---|---|---|---|---|
| Keyword in title tag | 4.57 | 4.9 | 66 | 94.4 | 8.22 | 8.34 |
| Keyword in body | 4.38 | 3.7 | · | 65.9 | 7.64 | 7.8 |
| Exact anchor text | 4.46 | 4.4 | 73 | 71.9 | 6.02 | 5.75 |
| Link popularity | 3.69 | 4.4 | 71 | 69.1 | 7.62 | 6.84 to 7.78 |
| Keyword / exact-match domain | 2.08 | 3.0 | 60 | 97.0 | 5.96 | 5.83 |
| Keyword in URL | 2.15 | 2.8 | · | 69.9 | 5.27 | 5.9 |
| Content quality | 3.38 | 3.0 | 65 | 93.7 | 7.99 | 7.85 |
| Topic modelling | · | 3.4 | · | 60.4 | 6.31 | 6.7 |
| CTR / user metrics | 2.62 | 2.8 | 42 | · | 6.29 | 6.92 |
| Speed | · | · | · | 53.3 | 5.84 | 6.6 |
| HTTPS | · | · | · | · | · | 4.59 |
| Mobile-friendly | · | · | · | · | 5.31 | 7.77 |
| Brand search | · | 2.0 | 36 | · | 6.74 | 6.54 |
| Tweets | · | · | 17 | 79.0 | 4.5 | 3.45 |
| Facebook shares | · | · | 12 | 61.6 | 3.93 | 3.16 |
| Google +1s | · | · | · | · | 5.05 | 3.63 |
| Authorship | · | · | · | · | 5.55 | 4.22 |
| Schema / structured data | · | · | · | 44.2 | 4.98 | 5.14 |
| Meta keywords | 2.08 | 1.2 | · | 5.2 | · | · |
| Category | 2009 | 2011 | 2013 | 2015 |
|---|---|---|---|---|
| Domain-level link authority | 24 | 21.13 | 20.94 | not recovered |
| Page-level links | 22 | 21.45 | 19.15 | not recovered |
| Social | 6 | 7.22 | 7.24 | last of all categories (3.98 of 10) |
The 2013 survey also asked what would grow. Those forecasts can now be scored:
- 96 of 121 expected authorship to grow. Authorship display was dropped. Moz measured it at −0.03.
- 92 of 121 expected structured data to grow. Correlation 0.02, then 0.01. Backlinko 2020 found none.
- 89 of 121 expected google+ to grow. The network was shut down.
- 82 of 121 expected social signals to grow. Last-rated Moz category by 2015; Google said it does not use them directly.
- 87 of 121 expected exact-match domains to decline. Came true. The leak names an exactMatchDomainDemotion.
Local search: the beliefs that moved most were never measured
The Local Search Ranking Factors survey has run since 2008 on panels of 20 to 47 local specialists. No correlation study of the local pack exists to check it against, so every number in this section is belief.
Show every edition's weights, 2013 to 2026
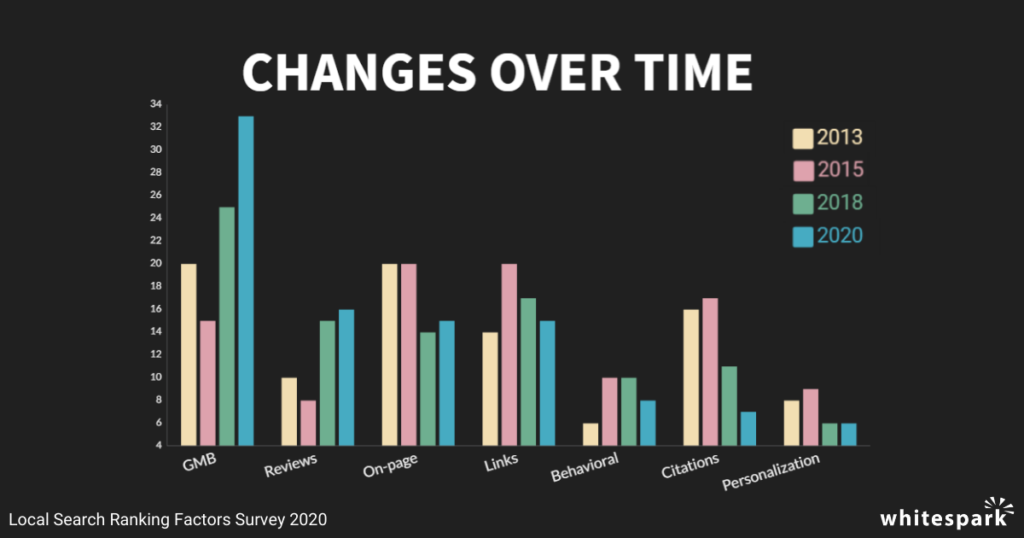
| Cluster | 2013C | 2014T | 2015T | 2017T | 2018T | 2020T | 2021T | 2023T2 | 2026T |
|---|---|---|---|---|---|---|---|---|---|
| Google Business Profile | ~20 | 14.7 | 14.7 | 19 | 25.12 | 33 | 36 | 32 | 32 |
| Reviews | ~10 | 9.8 | 8.4 | 13 | 15.44 | 16 | 17 | 16 | 20 |
| On-page | ~20 | 21 | 20.3 | 14 | 13.82 | 15 | 16 | 19 | 15 |
| Links | ~14 | 18.3 | 20 | 17 | 16.53 | 15 | 13 | 11 | 8 |
| Citations | ~16 | 15.5 | 13.6 | 13 | 10.82 | 7 | 7 | 7 | 6 |
| Behavioral | ~6 | 6.9 | 9.5 | 10 | 9.56 | 8 | 7 | 8 | 9 |
| Personalization | ~8 | 8.4 | 8.5 | 10 | 5.88 | 6 | 4 | 6 | 6 |
| Social | · | 5.8 | 5 | 4 | 2.82 | removed | removed | · | 4 |
| Cluster | 2017 | 2018 | 2020 | 2021 | 2023 | 2026 |
|---|---|---|---|---|---|---|
| On-page | 24 | 26.03 | 32 | 34 | 36 | 33 |
| Links | 29 | 27.94 | 31 | 31 | 26 | 24 |
| Behavioral | 11 | 11.5 | 10 | 11 | 9 | 10 |
Part of the profile's rise is relabeling, because proximity and keywords in the business name sit inside that cluster. Citations fell from the #2 specific factor of 2009 (LSRF 2009) to 6% of the pack in 2026 with no Google statement either way. Google's own documentation names relevance, distance and prominence (Google), which confirms the clusters exist and says nothing about their weights. The 2026 edition added an AI visibility dimension, in which on-page leads at 24% and citations rank third at 13%, ahead of the profile itself at 12%.
After Moz stopped asking
| Survey | Year | Sample | What respondents put on top |
|---|---|---|---|
| SEJ State of SEO | 2021 | not recovered | On-page 32.8%; user behavior 30.9%; links 17.4%T |
| Zyppy expert survey | 2026 | 131 respondents | Named in top 3: relevance 57.1%, backlinks 54.8%, content quality 47.6%, authority 36.5%, behavior 29.4%, brand 27.0%T |
| First Page Sage | 2026 | no method published | Keyword in meta title weighted 12%T |
The mass poll and the expert panel disagree on links, 17.4% against 54.8%, which tracks who was asked and how more than any change in Google. First Page Sage publishes percentage weights with no stated method; it is listed because it circulates as a study.
Why these numbers cannot go on one chart
The tables invite trend lines. Most of those lines would chart methodology, not Google.
| Study | SERP depth | Statistic | Vendor metric among the factors |
|---|---|---|---|
| Moz 2011 | top 30 | mean of per-query Spearman | Page Authority, Domain Authority |
| Moz 2013, 2015 | top 50 | mean of per-query Spearman | Page Authority, Domain Authority |
| Searchmetrics 2012 to 2015 | top 30 (2012 not stated) | per-keyword Spearman | SEO Visibility |
| Searchmetrics 2016 | top 20 | Spearman | its own content relevance score |
| SEMrush 2017 | top 100 | random forest importance order | its own traffic estimates |
| Backlinko 2020 | not recovered | correlation, no coefficients published | Ahrefs and Clearscope data |
| SEMrush 2024 | top 20 | Spearman of position against per-position averages | Authority Score, traffic estimates |
| Surfer 2025 | not recovered | Spearman | Surfer Content Score |
| Ahrefs 2025 | not a SERP study | correlation across brands | DR, Ahrefs mention counts |
SERP depth changes rho mechanically. Restricting the range of positions shrinks a rank correlation, so a move from the top 30 to the top 20 lowers every coefficient before Google does anything.
Averaging changes the size of the number. Moz and Searchmetrics averaged per-keyword coefficients. SEMrush 2024 correlated position against each position's average, which smooths away variance, so its ~0.47 for text relevance cannot sit beside Moz's 0.13 for a language model. Marcus Tober's 2014 write-up has the cleanest warning: the share of links with the keyword in the anchor fell from about 40% to about 27% while its correlation rose, because rho measures the slope across positions, not the level of use (Moz blog).
Survey scales changed every edition. Moz went from 1 to 5, to percent, to 0 to 100, to 1 to 10, which is why the survey section shows ranks rather than scores. Whitespark's own over-time chart re-plots earlier local editions one to two points away from what those editions printed.
Vendors grade their own metrics. Page Authority was a link model fitted to rankings, so its place atop every Moz edition partly reflects its design. Surfer's Content Score, SEMrush's Authority Score and Ahrefs' DR each appear as factors in studies their makers published. Searchmetrics' 0.67 for click-through rate is the same problem in pure form: position sets CTR.
Two distortions apply to every study: saturation hides real signals (98% of top 20 pages use HTTPS), and authority confounds anything strong sites tend to have, such as shares, length and brand mentions (SEJ).
Fifteen factors, three readings each
Later evidence comes in three strengths: Google's public statements, sworn testimony in US v. Google, and the Content Warehouse API leak, which Google confirmed as authentic in May 2024 (Wikipedia). The leak lists 2,596 modules and 14,014 attributes with no weights, so it proves a feature exists, not how much it counts. The testimony is more specific. Asked in October 2023 whether "the navboost system memorizes past clicks that have been issued for past queries," Google's Pandu Nayak answered "Yes," and confirmed it covers "all queries received in the past 13 months" (trial transcript, p. 6405).
| Factor | What experts believed | What correlated | Later evidence | Verdict |
|---|---|---|---|---|
| Links and site authority | Top category in every Moz survey; Zyppy 2026 2nd; local pack weight 20% to 8% | Strongest family in every study, 0.17 to 0.39 | siteAuthority and homepage PageRank in the leak | Vindicated |
| Anchor text | 1st or 2nd 2005 to 2009, mid-table by 2013 | Flat at 0.24 to 0.28 (Moz) | Spam-anchor spike detection in the leak | Still a signal, spam policed |
| Keyword in title | Top on-page factor in every Moz edition | 0.02 to 0.04, then about zero | titlematchScore in the leak | Real, hidden by saturation |
| Content length | The long-form era, set off by the studies | 0.07 to 0.12, then 0.02 | Mueller: word count is not a factor | Not a cause |
| Social signals and +1 | Peaked 2011, last category by 2015 | 0.17 to 0.37 | Cutts: not used that way | Not a direct factor |
| Exact-match domain | 2.08 of 5, then 97.0 of 100, then 5.83 of 10 | 0.38 (2010) to 0.20; Searchmetrics −0.02 | exactMatchDomainDemotion in the leak | Boost gone, demotion exists |
| Clicks and engagement | 2.62 of 5 (2005) to 6.92 of 10 (2015); SEJ 2021 2nd | Vendor traffic proxies only | Sworn testimony: NavBoost memorizes past clicks over 13 months; goodClicks, badClicks in the leak | Vindicated in mechanism |
| Brand | 2.0 of 5 (2007) to 6.74 of 10 (2013) | 0.20, 0.19; AI Overviews 0.664 | Mechanism unresolved | Vindicated in importance |
| Speed and Core Web Vitals | 5.84 to 6.60 of 10 | −0.10; later 0 to 0.09 | Google: real, "not giant factors" | Confirmed, small |
| HTTPS | 4.59 of 10 (2015) | 0.04 to 0.05, then 0.007 | Google 2014 announcement | Confirmed, weak |
| Mobile | 5.31 to 7.77 of 10 | 0.00 and −0.04 | Google 2015 rollout | Confirmed, saturated |
| Schema and authorship | 92 and 96 of 121 forecast growth in 2013 | 0.01 to 0.02; −0.03 | Authorship display dropped; isAuthor in the leak | Markup is not a lever |
| Topical relevance | 3.4 of 5 to 6.70 of 10; Zyppy 2026 1st | LDA 0.32 corrected to 0.17; 0.13 to 0.15 | Semantic scoring in the leak; Mueller: no "LSI keywords" | Semantics yes, LSI label no |
| Age and the sandbox | Steady mid-scale belief | Domain age 0.11; #1 page 2 then 5 years old | hostAge in the leak | Vindicated in substance |
| Local GBP, reviews, citations | GBP 15% to 36%; citations 16% to 6% | Never measured | Google: relevance, distance, prominence | Clusters real, weights unverifiable |
The record supports a sharper rule than "correlation is not causation." Google's denials held up for on-page folklore: meta keywords, keyword density, LSI and word count (Mueller on word count). They did not hold up for aggregates that can be gamed: clicks, site authority, host age and Chrome data. The correlation studies failed in the mirror pattern, over-reading confounded aggregates (social, traffic, length) and under-reading saturated basics (titles, HTTPS, mobile).
The same study, now pointed at AI answers
The template has moved to a new outcome. Ahrefs correlated brand signals with visibility in AI Overviews and found branded web mentions at 0.664, about twice Domain Rating at 0.326 (Ahrefs). That is the highest coefficient anywhere in this history, and it is a cross-brand correlation built on the publisher's own mention counts. Meanwhile, the share of AI Overview citations drawn from the organic top 10 fell from 76% to 38% (SEJ). Those numbers deserve the skepticism the 2013 +1 correlation eventually earned.
We ran the belief half of this page forward. Belief vs Measurement takes the September 2026 expert survey and checks it against 12,778 AI answers we logged, including how rarely an engine returns the same sources twice. The 18-Year Shift counts what was actually said on this show from 2009 to 2026, which is the practitioner record with the survey filter taken off.
How this was compiled
Every value is graded by the copy we actually read, not by the original study's quality:
| T | Printed on the primary page (incl. Wayback snapshots and embedded page data) |
|---|---|
| T2 | Printed in a secondary source (press coverage or recap) |
| P | Text in the vendor's own PDF |
| I | Exact value printed as a label on a chart image |
| O | Chart label matched to its factor by order in a SlideShare transcript |
| C | Read off a chart by eye, about 1 point either way |
Left out on purpose: Searchmetrics 2013 and 2016 coefficients (search snippets only; the originals 403 or 404), a widely repeated Searchmetrics 2014 "relevant terms 0.54" (we could not trace it to the study), percentage-change claims about the 2018 local survey that do not reconcile with the survey itself, and any "Moz 2017" study (Moz's last general edition is 2015). Still open: Searchmetrics 2015 values are order-matched and need checking against the original whitepaper, the SEMrush 2024 values marked C are read off its charts.
Sources
Show all 49 sources
- Moz survey 2005 (Wayback)
- Moz survey 2007 (Wayback)
- Moz survey 2009 (Wayback)
- Moz 2011 study (Wayback)
- Moz 2011 chart images (Wayback)
- Moz 2013 correlations (Wayback)
- Moz 2013 survey (Wayback)
- Moz 2013 methodology (Wayback)
- Moz 2015 correlations (Wayback)
- Moz 2015 survey (Wayback)
- Moz 2015 methodology (Wayback)
- SEOmoz LDA correction, 0.32 to 0.17 (Wayback)
- Searchmetrics 2012, via Website Magazine
- Marcus Tober on Searchmetrics 2014, Moz blog
- Searchmetrics 2015 whitepaper, SlideShare
- Searchmetrics 2016 press release reprint
- Practical Ecommerce on Searchmetrics 2016
- Holly Miller Anderson on ending the universal study
- Backlinko 2016, via Sujan Patel
- Backlinko 2020, 11.8M results
- SEMrush Ranking Factors Study 2.0 (PDF)
- SEMrush Ranking Factors Study 2024 (PDF)
- Surfer ranking factors study
- Ahrefs, AI Overview brand correlation (2025)
- Ahrefs, page age of top results
- SEJ on AI Overview citations from top 10 pages
- SISTRIX, Core Web Vitals natural experiment
- Local Search Ranking Factors 2008 (Wayback)
- Local Search Ranking Factors 2009 (Wayback)
- Local Search Ranking Factors 2014 (Wayback)
- Local Search Ranking Factors 2015 (Wayback)
- Local Search Ranking Factors 2017 (Wayback)
- Local Search Ranking Factors 2018 (Wayback)
- Whitespark over-time chart
- Whitespark LSRF 2020
- Whitespark LSRF 2021
- Advice Local on LSRF 2023
- Whitespark LSRF 2026
- SEJ State of SEO 2021
- Zyppy 2026 expert survey
- First Page Sage 2026
- iPullRank on the 2024 Content Warehouse leak
- 2024 Google Search documentation leak (Wikipedia)
- SparkToro on the leaked API documents
- Matt Cutts on the +1 correlation, Hacker News
- US v. Google trial transcript, 18 Oct 2023 PM, Pandu Nayak (pp. 6402 to 6413)
- SEJ, Roger Montti on correlation studies
- Search Engine Roundtable: word count is not a ranking factor
- Google Business Profile Help: how local results are ranked